Portfolio Health
Regardless of your use case (modernization, move to cloud, due diligence,…), having some insight into your portfolio’s quality is always a good thing. Refactoring required by a cloud migration might as well be accompanied by health improvements.
Demographics
Our first stop is the Portfolio Demographics dashboard where we can see our overall technology breakdown.
Click anywhere on the pie chart to bring up the list of technologies, and then on any technology in the list to bring up the related applications:
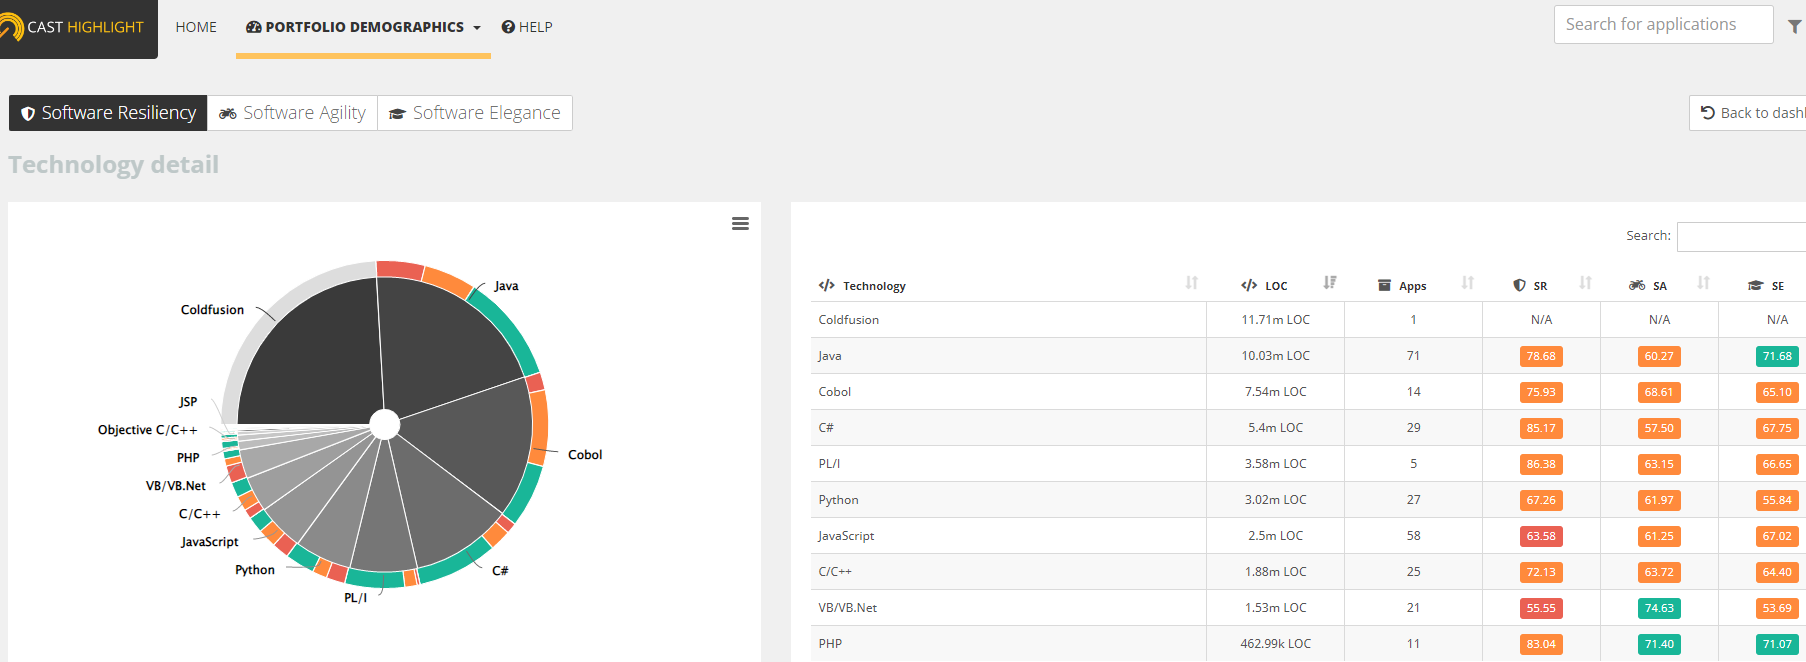 Just starting here with our modernization project would be a good place to ask the following questions:
- What are we doing with orphaned technologies like Ruby and Scala? Do we have a plan to migrate them… or to phase them out?
- What is our strategy for those big COBOL monoliths? Which ones aren’t as sturdy as we’d like? Are they important to us?
And that’s only the beginning… click on the Back to Dashboard button in the top right to see the other dimensions we can explore here:
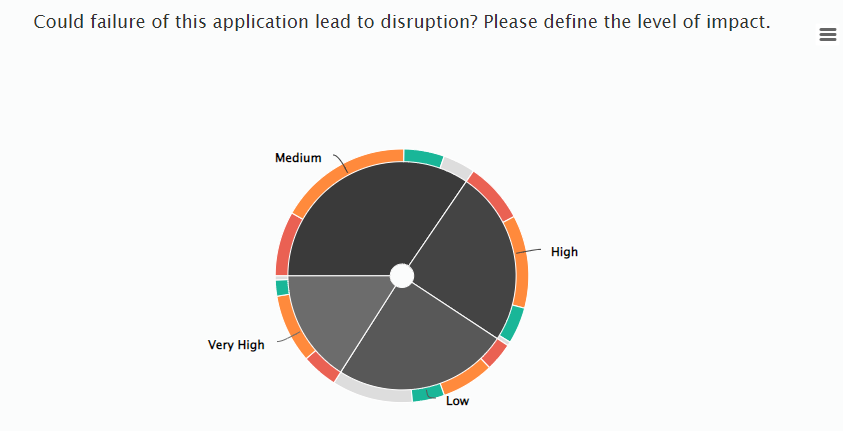 These are all the demographics broken down by the answers to each survey question. Go ahead and try to answer the following questions:
- How many applications are being developed by teams of extremely inexperienced people?
- Which one of those apps has the highest Business Impact?
- Isn’t that a bit worrying?
- How many ERPs are we using?
- Which one has the highest maintenance cost?
Questions like this naturally arise when looking at such pie charts and they open the door to asking “Do we need all those apps? Isn’t there some redundancy there?". Only you can answer that, but CAST Highlight can probably help you by going to the DASHBOARDS menu and choosing Application Categories.
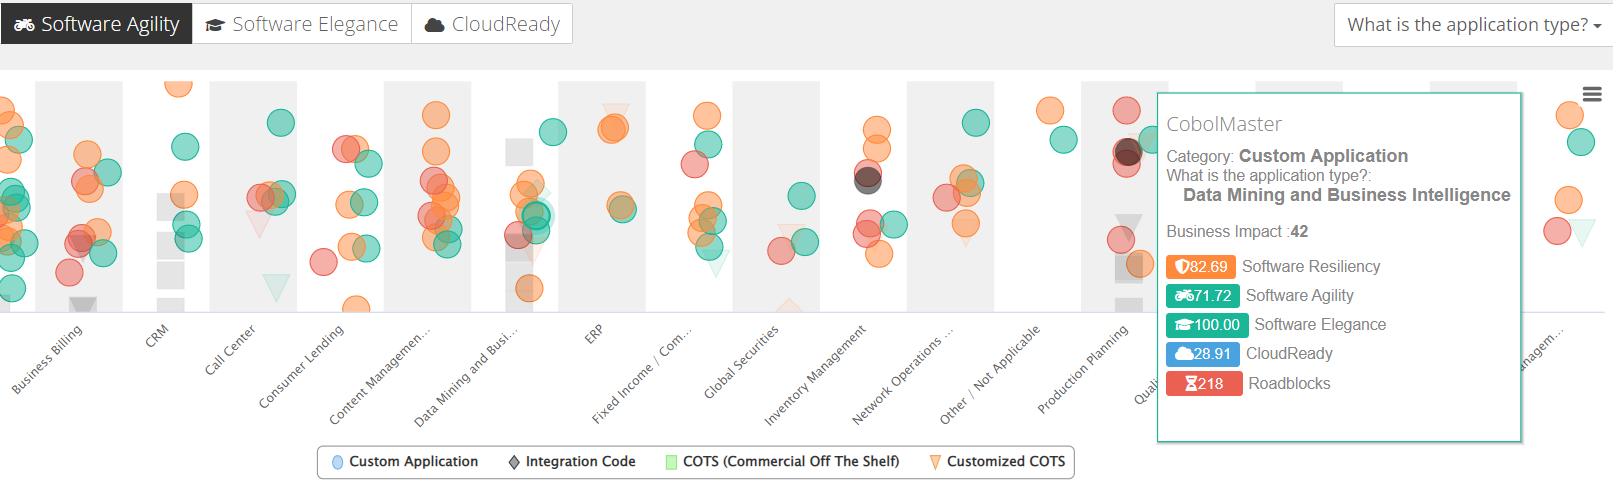 Notice that you can get this kind of breakdown for any survey question (see the selector in the top right). This should definitely help with Portfolio Rationalization.
Another Decision Matrix
We have many ways to cater to the interests of a portfolio manager. Another one would be to simply answer the question How do I manage my application’s quality from here? Click on the top menu’s HOME tab from the home page, click on the SOFTWARE HEALTH tile.
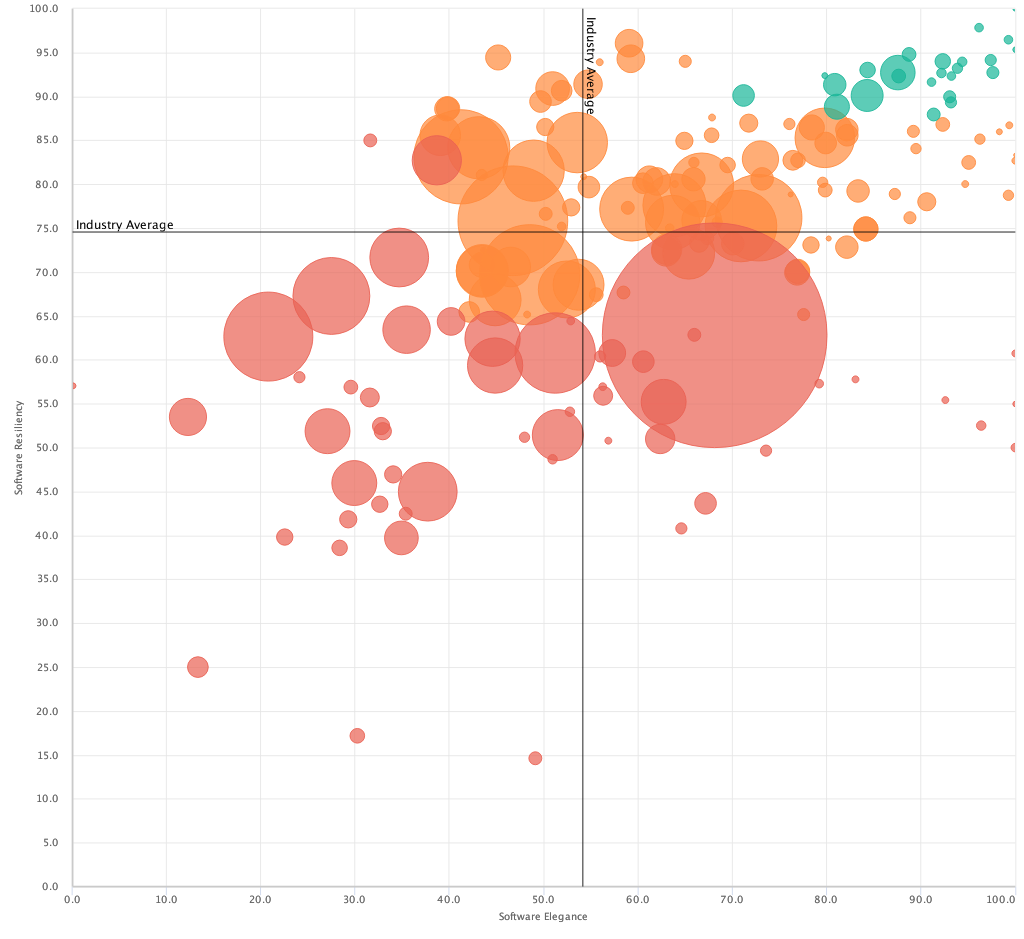 Here is another useful bubble chart comparing Software Resiliency to Business Impact… and once again we find 4 quadrants:
- In the bottom right: applications that are healthy and relatively unimportant. We’ll leave them be.
- In the bottom left: applications that are unhealthy and unimportant – good candidates for that rationalization we just talked about.
- In the top right: applications that healthy and business-critical. That’s good news, but we probably want to keep monitoring them (did you notice there’s a Trends dashboard?)
- In the top left: our problem area – we have to do something about those. Clicking on a bubble takes us to the app list, and clicking on the app name brings us back to the application’s results dashboard.
- From there, as we saw earlier, we’ll be able to see where that low health comes from, match it to improvement opportunites on the Code Insights page.
- Maybe use the Export to Excel feature to give those to the app’s dev team so they can use that insight to put together an action plan to improve the application’s health.
These charts that place applications on a 2-dimensional grid can be generated at will, using any metric known inside CAST Highlight (including custom KPIs derived from custom survey answers). Check it out by going from the top menu into DASHBOARDS and then Custom Dashboard.
Technical Debt
The last metric we should visit is in the DASHBOARDS top menu tab, under Technical Debt.
Technical Debt represents the effort required to fix problems that remain in the code when an application is released. This concept is popular in many use cases that Software Intelligence supports: Application Portfolio Rationalization, Software Health Assessment, Tech Due Diligence, etc.
Technical Debt estimates rely exclusively on CAST Highlight’s code insights and their respective number of occurrences found during the code scan. For each improvement opportunity we have a standard value for the time it takes to remediate it (those can also be customized to be tailored to your organization’s skills). The total technical debt of an application is just the sum of them all.
In the dashboard’s menu, click on the Portfolio Advisor for Technical Debt tab and check out how you can explore where that debt actually comes from:
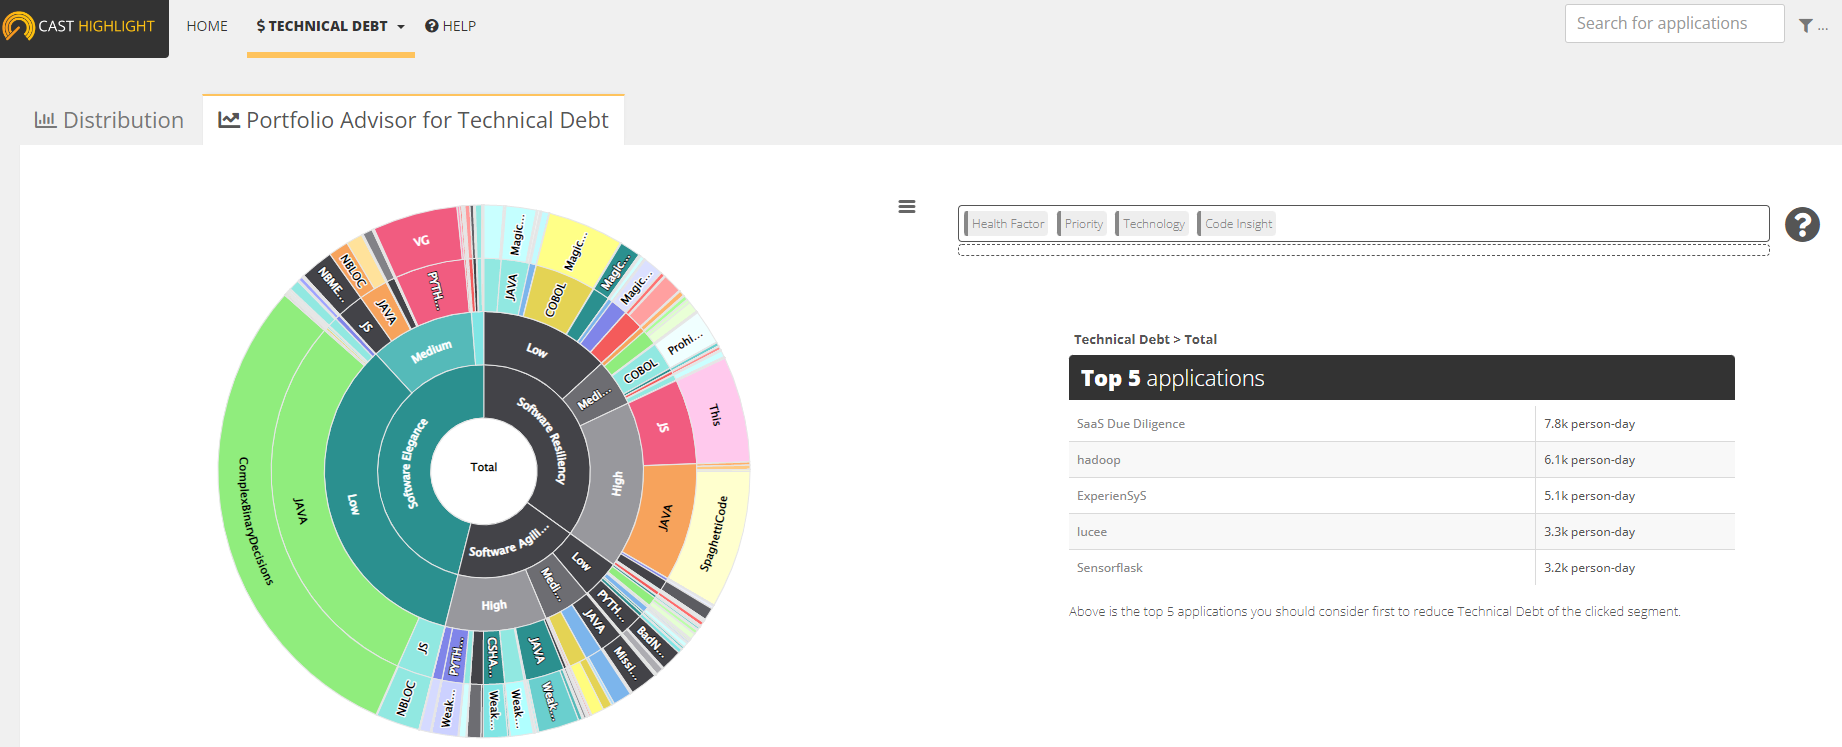 Can you find out
- which technology bears the most technical debt?
- (in the right panel, drag the Technology box to first position)
- across all COBOL apps, which app bears the most debt?
- (on the color wheel, click on the COBOL section and you’ll see the wheel zoom in and the top 5 apps appear on the right)
Wrapping it up
Well, that was lot of screens and data to digest in such a short time. Feel free to come back to the examples we showed or just explore the interface at your leisure.
We are reaching the end of our journey together… or is it just the start?